Many students who perform poorly in math at the beginning of elementary school improve their arithmetic fluency if they do one hour a week of activities that are designed to work on the concept of numbers. In other words, students improve their ability to do simple mathematical operations and procedures quickly. This is shown by the ARTIST study (Automatic Response to Intervention Study), recently published by the academic journal SN Social Sciences, carried out by the Innovamat R&D team. The study validates an early intervention program, consisting of an initial test, supportive intervention for the students who are having the most difficulties, and a second, subsequent test. This second test assesses both the response of each student to the intervention and the effectiveness of the tool.
Study methodology
The ARTIST study uses the theoretical framework of Response to Intervention (RTI), which consists of firstly detecting low performing students who may need support; secondly, intervening in their learning; and lastly, seeing how they respond to the intervention. The scientific literature demonstrates that this framework allows for the development of more effective tools for identifying and addressing academic underperformance than those based on other theoretical frameworks1.
ARTIST’s objective was to test whether the tools developed by Innovamat are capable of effectively implementing the RTI theoretical framework. To carry out the study, the research team selected 13 schools in Catalonia, of which 5 were part of the intervention group, and 8 were in the control group. The 418 elementary students at these schools took a universal screening test to identify those in the lowest percentile of arithmetic fluency. This test consists of 8 tasks that assess the following cognitive skills and knowledge underlying math learning:

Answering speed
Click the mole repeatedly as fast as you can until time runs out.

Visual processing speed
Find the image among the options, or click NO, if it is not there.

Knowledge of digits
Click the largest digit repeatedly as fast as you can until time runs out.

Comparing numbers
Observe images of dots for a short period of time and indicate which color dots there were most of.

Number Line
Indicates where on the line the number is found.Indica en qué posición de la recta se encuentra el número.

Arithmetic fluency
Solve operations as fast as you can until time runs out.

Working Memory
First, memorize the images. Next, of the 4 faces, select the odd one out. Then, select all the images you have seen.

Reasoning
Select the piece that completes the image.
Figure 1. Activities of the universal screening test, where the cognitive skills and knowledge underlying the learning of mathematics are assessed.
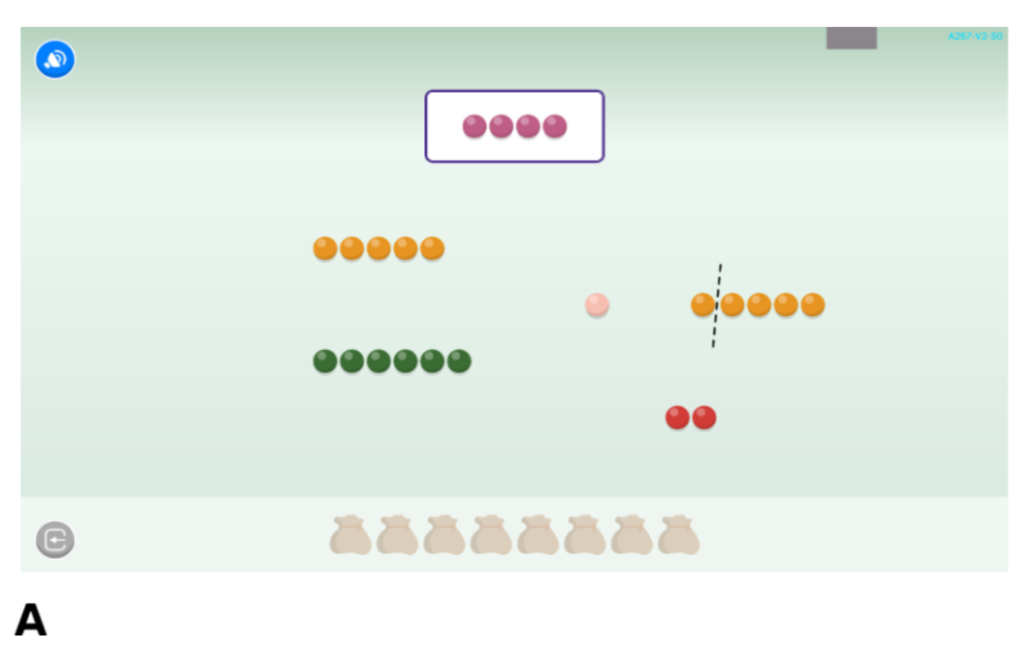
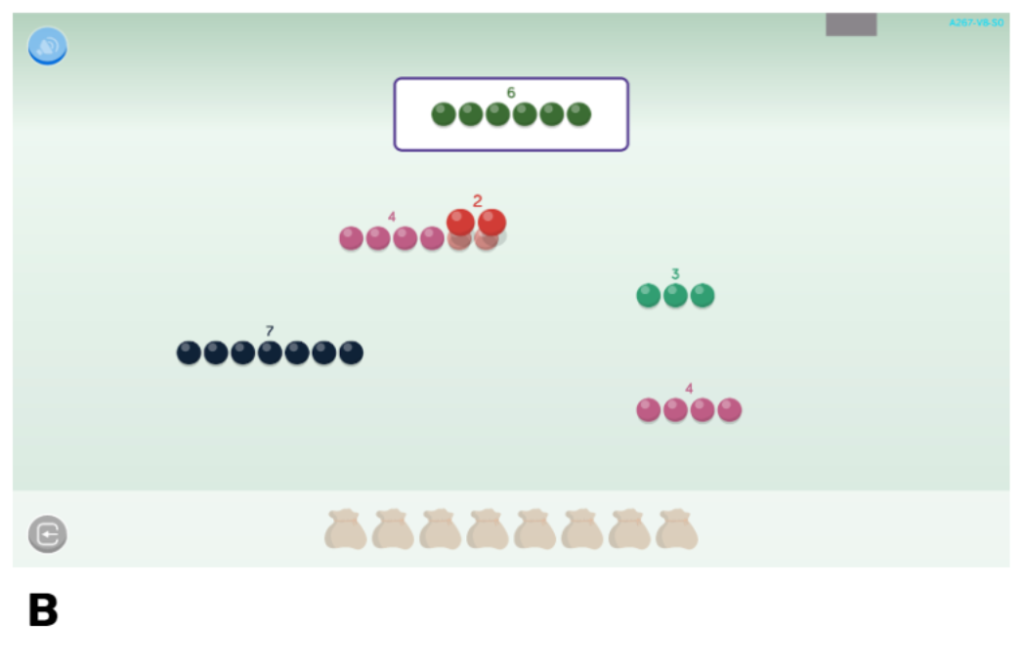

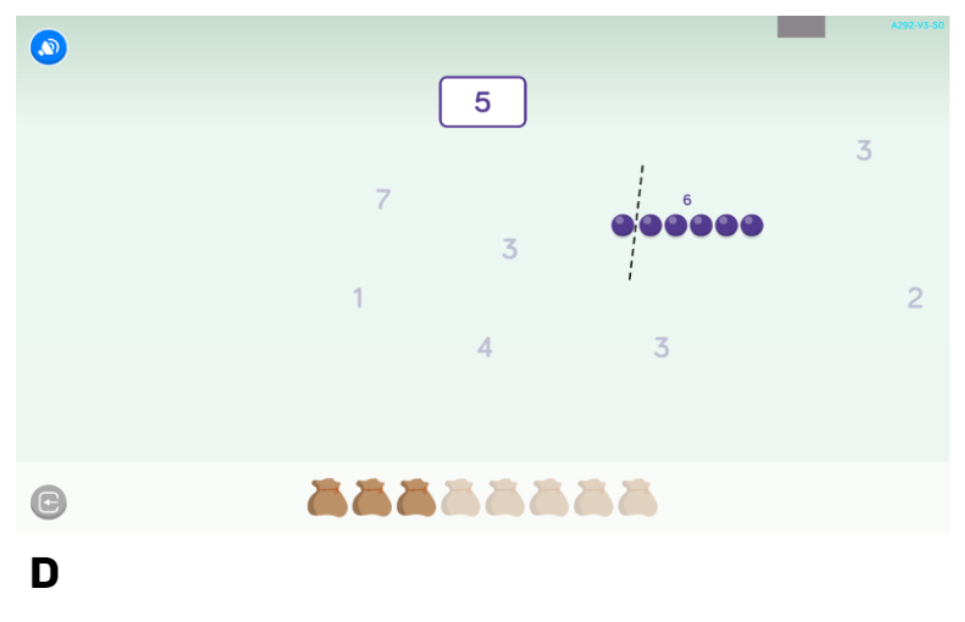
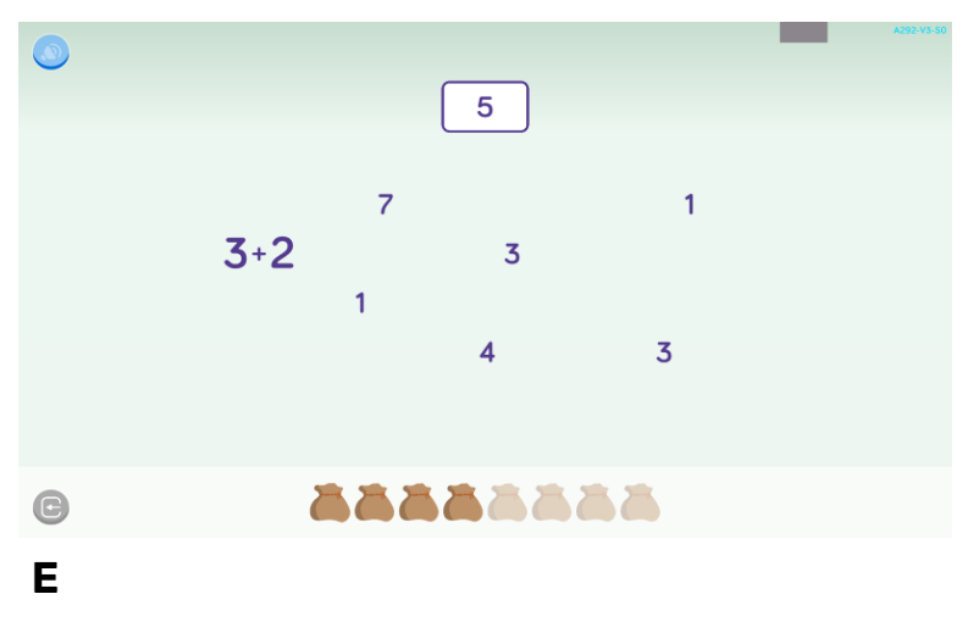
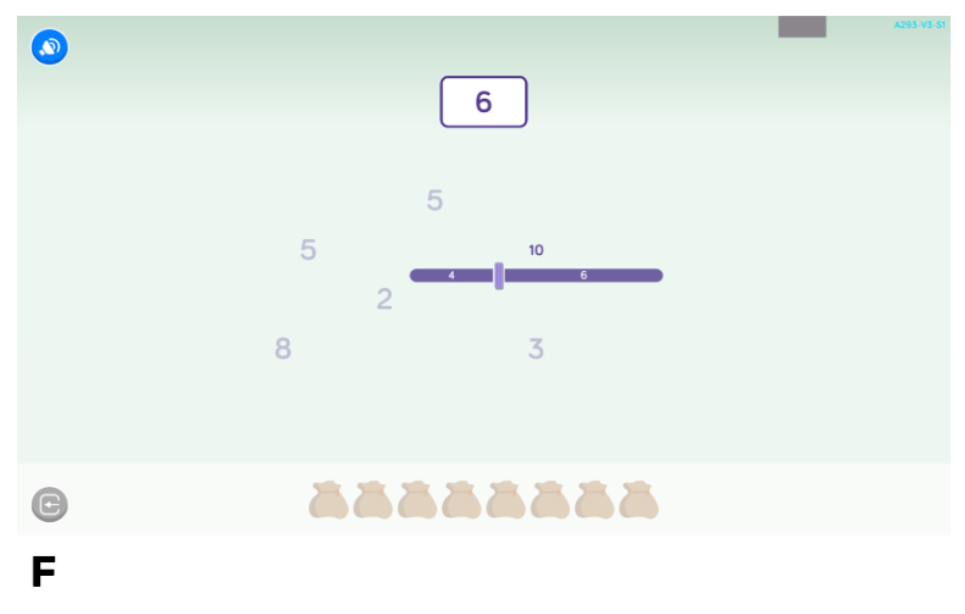
Figure 2. Teaching progression of the number concept acquisition activity.
Early intervention improves arithmetic fluency
The research compares the improvement in arithmetic fluency of underperforming students, according to whether they have participated in the support intervention or not. The results obtained show that those who have been part of the intervention not only improve their arithmetic fluency significantly more than other students, but 81% of these students exceed their score in the initial test that had identified them as low-performing students. Without any intervention, on the other hand, the percentage of students who improve out of the low-performing zone after the same period of time is 53%.
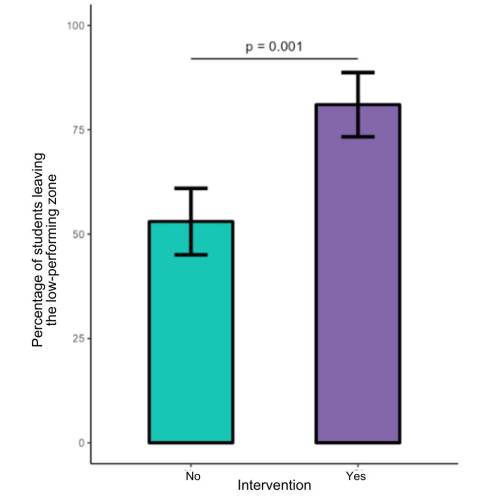
Figure 3. Percentage of students who leave the underperforming area in the subsequent test, according to whether they participated in the intervention (right, in purple) or not (left, in green). The error bars indicate the 95% confidence interval. The p-value = 0.001 comes from a Chi square test on the results.
In summary, the results show that the percentage of underperforming students who participated in the intervention and improved is significantly higher than the percentage of students who did not receive intervention. Obviously, in the same period, students who had not been identified as underperforming also improved their results, but to a lesser extent.
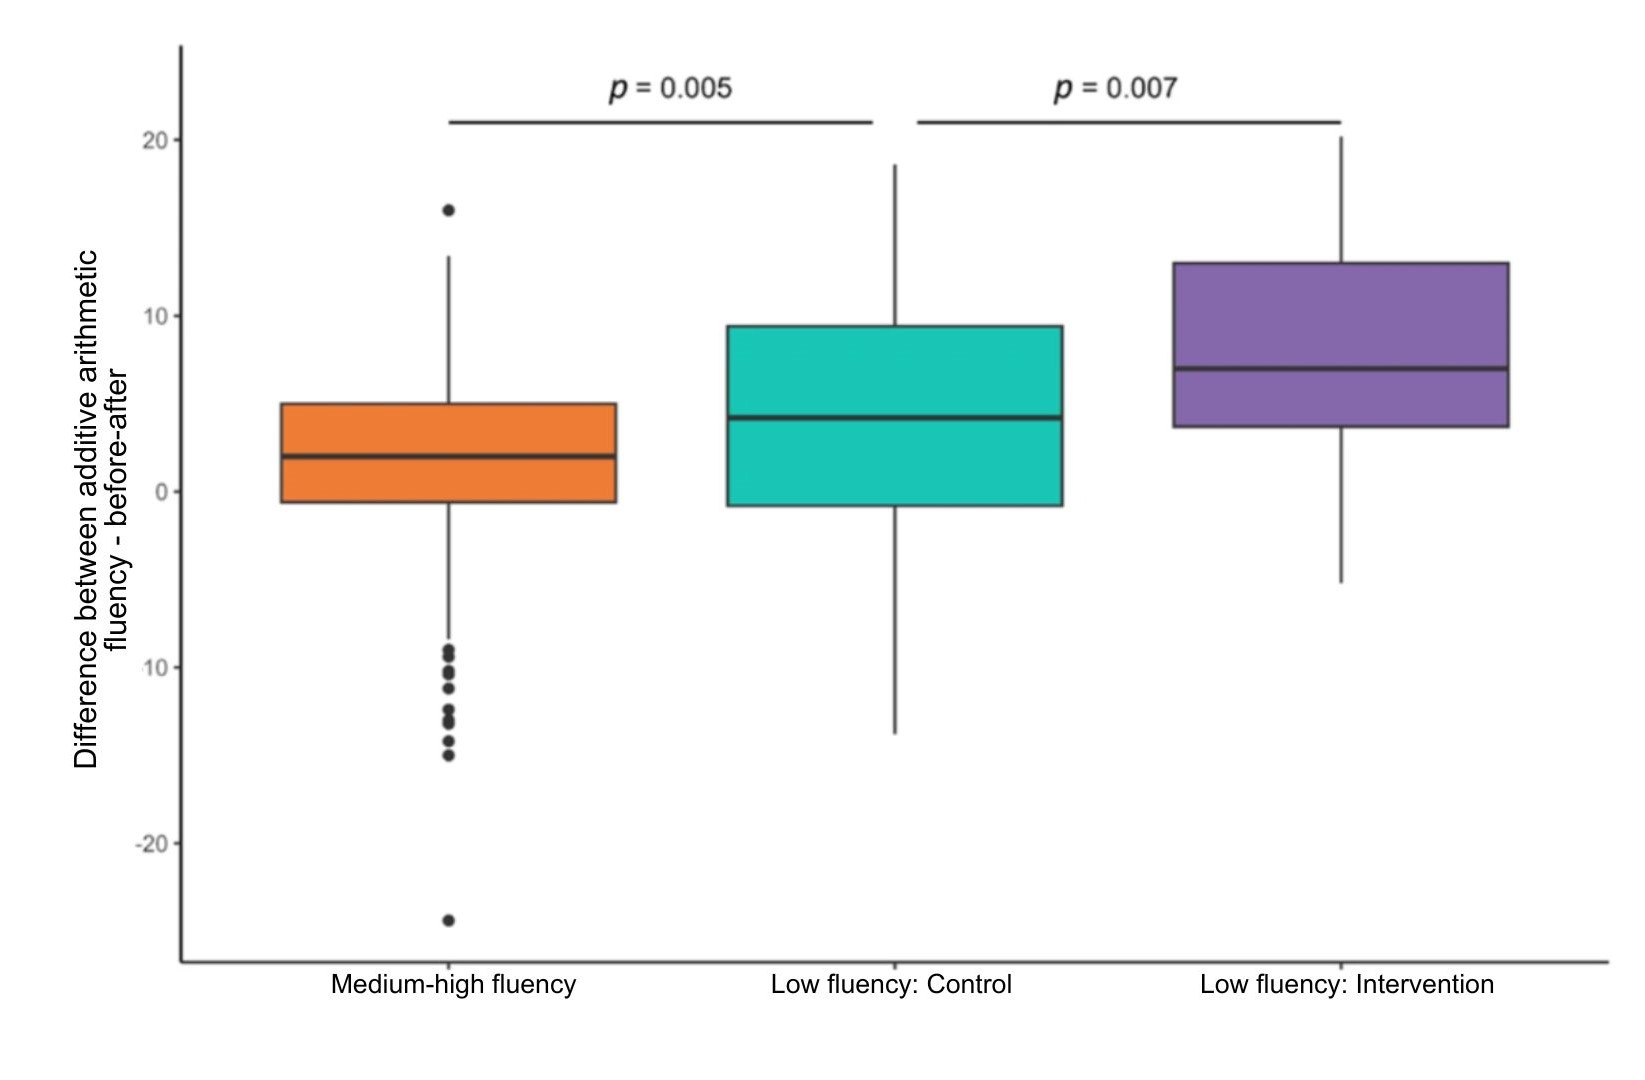
Figure 4. Comparison of differences between additive arithmetic fluency before and after the intervention period: the group “Medium-high fluency” corresponds to the students of the 13 schools that scored at or above the lowest percentile. The “Low Fluency: Control” and “Low Fluency: Intervention” groups are those of the 8 control schools and 5 intervention schools, respectively, which scored lower than the percentile.
Making early intervention accessible to schools
One of the objectives of the study has also been developing scalable tools to implement RTI in educational systems that are not familiar with this theoretical framework or do not have the staff to implement it. To address this problem, the Innovamat R&D team has opted for a technological solution that makes these resources more accessible.
Using technology to implement RTI isn’t necessary, but it allows schools to bring it to their classrooms without having to invest both economically and in staff. The ARTIST study shows that it is possible to implement the RTI framework successfully in schools that do not have resources available to dedicate to it. Currently, up to 43 schools have implemented this intervention program.
The results of this study show that research has a real impact on the students’ educational trajectory. It is key in continuing to bring research closer to the classroom through scientifically validated tools that help us improve our students’ math learning.
References
1
Fletcher JM, Vaughn S (2009) Response to intervention: preventing and remediating academic difficulties. Child Develop Perspect 3(1):30–37. https://doi.org/10.1111/j.1750-8606.2008.00072.x
Hughes CA, Dexter DD (2011) Response to intervention: a research-based summary. Theory Pract 50(1):4–11. https://doi.org/10.1080/00405841.2011.534909
Gersten R, Haymond K, Newman-Gonchar R, Dimino J, Jayanthi M (2020) Meta-analysis of the impact of reading interventions for students in the primary grades. J Res Educ Eff 13:1–27. https://doi.org/10.1080/19345747.2019.1689591
2
Butterworth, B. (2018). Dyscalculia: From science to education. Routledge.
3
Butterworth B, Laurillard D (2016) Investigating dyscalculia: a science of learning perspective. In: From the laboratory to the classroom. Routledge, pp 184–202. https://doi.org/10.1126/science.1201536
4
Duncan, G. J., Dowsett, C. J., Claessens, A., Magnuson, K., Huston, A. C., Klebanov, P., Pagani, L., Feinstein, L., Engel, M., Brooks-Gunn, J., Sexton, H., Duckworth, K., Japel, C., Cordray, D., Ginsburg, H., Grissmer, D., Lipsey, M., Raver, C., Sameroff, A., … Zill, N. (2006). School Readiness and Later Achievement.
Geary DC (2011) Cognitive predictors of achievement growth in mathematics: a 5-year longitudinal study. Dev Psychol 47(6):1539–1552. https://doi.org/10.1037/a0025510
5
Geary DC (2011) Cognitive predictors of achievement growth in mathematics: a 5-year longitudinal study. Dev Psychol 47(6):1539–1552. https://doi.org/10.1037/a0025510
Jordan et al (2009) Early math matters: kindergarten number competence and later mathematics outcomes. Dev Psychol 45(3):850–867. https://doi.org/10.1037/a0014939
Vasilyeva M, Laski EV, Shen C (2015) Computational fluency and strategy choice predict individual and cross-national differences in complex arithmetic. Dev Psychol 51(10):1489–1500. https://doi.org/10.1037/dev0000045


