
- Our research team conducted two studies in Mexico and Catalonia to analyze whether the use of Innovamat correlates with good performance on the TIMSS test.
- Students who used Innovamat performed better on the adapted TIMSS test than those from schools that used other educational curriculums.
- A negative correlation was also observed between math anxiety and results on the adapted TIMSS test.
One of the fundamental aspects for Innovamat, and especially for Vertex, its research group, is being able to analyze the impacts of the curriculum’s use in the classroom through various studies. One of these impacts could be the effect on students’ results on standardized tests, for example, the TIMSS tests.
What are the TIMSS tests?
The TIMSS tests (Trends in International Mathematics and Science Study) are international tests organized by the International Association for the Evaluation of Educational Achievement (IEA) for mathematics and science. They are conducted every 4 years and are aimed at students in 4th grade and 8th grade. In the most recent version from 2019, 64 countries participated, making it one of the most validated instruments in global educational evaluation.
TIMSS evaluates how well the curriculum content is understood and applied. To do this, it focuses on three cognitive dimensions:
- Knowledge: Do students remember and understand mathematical concepts?
- Application: Do they know how to use this knowledge to solve problems?
- Reasoning: Do they use logical and critical thinking to solve more complex problems?
TIMSS also analyzes contextual factors that can influence learning, such as the school environment, family support, and available educational resources. However, we will focus on the part of the tests that relates to mathematics.
How have we analyzed this impact?
Over the past two years, the research team has conducted studies to analyze whether the use of Innovamat is related to good performance on the TIMSS mathematics test. These studies were conducted in Catalonia (Spain) and Mexico over two consecutive years: one study during the 2022-2023 academic year and another during the 2023-2024 academic year.
Figure 1.
A visual representation of the study design.

For each study and in each territory, two groups of schools were determined:
- An intervention group: schools implementing the Innovamat curriculum.
- A control group: schools that are not implementing the Innovamat curriculum.
To enhance comparability in Mexico, we selected schools with similar socio-economic profiles that exhibited no significant differences in the Human Development Index (HDI). The Human Development Index (HDI) is developed by the United Nations Development Program (UNDP) and is used to assess the level of prosperity in various nations. In this study, all schools had an HDI ranging between 0.7 and 0.9, with no significant differences observed between the intervention group and the control group. However, we faced limitations in obtaining demographic data about the schools in Catalonia, which prevented us from accounting for socioeconomic factors.
For both the intervention and control groups, an adaptation of the TIMSS test was created based on the open-ended questions from the 2019 test in Chile for 4th grade students.
The distribution of questions strictly adhered to the original test’s content blocks and cognitive domains, preserving the integrity of each question’s specific content. The tests were adapted in three key areas:
- Linguistic adaptation: The questions were translated and adapted to the territorial context of each region.
- Question Type: Due to technological limitations, only multiple-choice questions were utilized. From the remaining questions, a total of 26 items were randomly selected (the original test comprises between 20 and 28 questions, depending on the block assigned to each student).
- Extended time: The allotted time for completing the test was extended from 36 to 60 minutes. This adjustment aimed to reduce the stress caused by time constraints, allowing the majority of students to finish within the available time.
As you might imagine, the next step was for each group to take the test, followed by a comparison of the results. In total, the adapted TIMSS test was administered to 4,393 students—2,407 of whom used Innovamat materials, while 1,986 used materials from other educational programs (see Table 1).
Table 1.
Sample of students included in the final analysis.
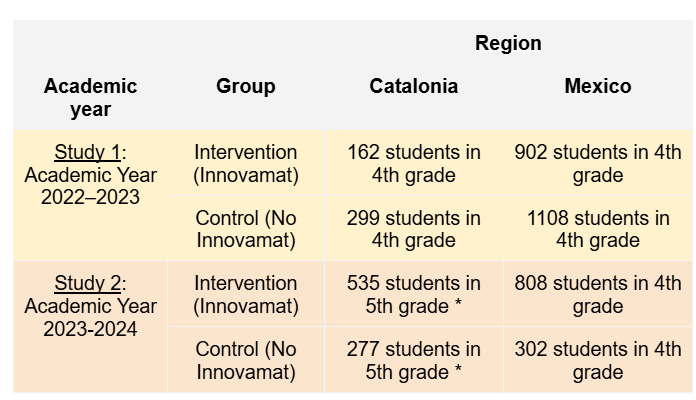
* For both the intervention group and the control group, it was decided to administer the test in 5th grade because, the previous year, some schools informed us that at the time of taking the test, it included content they had not yet covered in 4th grade.
What were the results?
Our primary research question was: Are there differences in TIMSS test results between students who follow the Innovamat curriculum in the classroom and those who do not?
To answer this question, we used the Scheirer-Ray-Hare test1, with the TIMSS test results as the dependent variable and the group (intervention or control) and region (Catalonia or Mexico) as independent variables. In both the 2022-2023 academic year (Study 1) and the 2023-2024 academic year (Study 2), the test found a significant effect of the group variable and the region variable (in all cases, p < .001)2. This indicates that the results of the adapted TIMSS test were significantly different between the two groups and the two regions.
Additionally, we investigated the interaction between the two variables, group, and region, to see if the significant effect of using Innovamat could come from differences in a specific region or if, on the contrary, the effect was similar in both regions. In neither study was a significant interaction found between the two variables analyzed (in all cases, p > 0.1). This indicates that the differences in the TIMSS test results observed for the group variable are similar in both regions.
These analyses show that schools using the Innovamat curriculum obtained better results in the adapted TIMSS test than schools using other educational curriculum. We can see this in the following graph (Figure 2).
Although it was not our main question, we also see a significant effect of the region where the test was administered in each grade. In the 2022-2023 academic year, schools in Mexico generally obtained better results than schools in Catalonia. Conversely, the result was the opposite in the 2023-2024 academic year. Since the test was administered at different times and academic years in each region, it is not possible to interpret these differences as real differences between regions (see the discussion in the conclusion).
Figure 2.

Note. This graph shows the average percentage of correct answers in the TIMSS tests and the confidence interval (95%) of these results for the academic years 2022-2023 and 2023-2024 in both Catalonia and Mexico. The two groups in the studies—the intervention group (using Innovamat) and the control group (not using Innovamat)—are separated by colors. Based on the data we have obtained, the confidence interval in a bar chart shows the range in which we believe the actual value (in this case, the mean of a population) lies. In this case, the vertical bars indicate that if we repeated the experiment many times, in theory, the average value would fall within this range 95% of the time.
Socio-emotional aspects: mathematical anxiety and performance
In Study 2 (2023-2024), data on students’ math anxiety were also collected using the Modified Abbreviated Math Anxiety Scale (mAMAS) questionnaire, which has been validated in multiple studies (Carey et al., 2017; Caviola et al., 2017; Hopko et al., 2003). The collected data allowed us to observe the correlation between math anxiety and students’ math competence, measured through the adapted TIMSS test.
In the following graph, we can observe the correlation (ρ = -0.36, p < 0.001) between the TIMSS test results and the math anxiety perceived by students. The Spearman correlation coefficient (ρ) indicates that the correlation is moderate, according to Cohen’s (1988) standards, which are widely used in social sciences: (0.10 – low, 0.30 – moderate, 0.50 – high). This means that students with higher math anxiety tend to obtain lower scores on the adapted TIMSS test.
Figure 3.
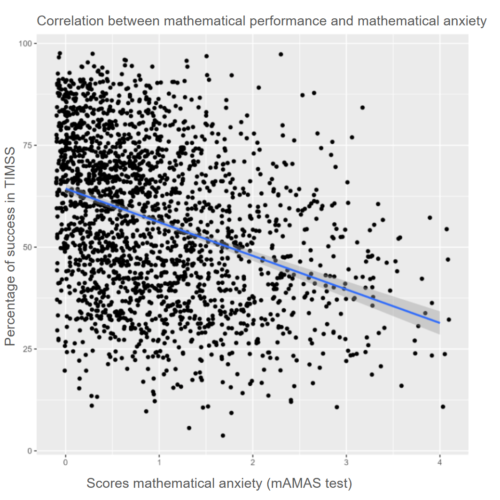
Note. This graph shows a scatter plot of the individual results of all students, where each point represents a student’s score. The blue line indicates a linear regression, suggesting that students with higher scores on the math anxiety test (x-axis) tend to perform worse on the adapted TIMSS test (y-axis). The gray shading around the regression line shows where we expect the average values of the dependent variable (percentage of correct answers in TIMSS) to fall for a given value of the independent variable (math anxiety scores) with 95% confidence. This indicates the uncertainty about the position of the average trend line, not about individual values. In simple terms, we are 95% confident that the blue line, which indicates the correlation between anxiety and TIMSS outcomes, should fall within the range indicated by gray shading.
What conclusions can we draw?
The main objective was to identify whether students using Innovamat educational resources in their schools achieve better results than students using other materials, primarily textbooks. To this end, a math test was adapted from the open questions of the 2019 TIMSS test. The results indicate that students in schools with Innovamat perform better on the adapted TIMSS test than students in schools in the control group. Additionally, this result is consistent over two academic years and in two regions, Catalonia and Mexico.
We also see general differences in results between the regions, although these differences are likely due to the test being administered earlier in Catalonia (March) than in Mexico (May/June) in 2022-2023 and different grades (4th grade in Mexico and 5th grade in Catalonia) in 2023-2024. Therefore, these differences between regions are not particularly informative.
Another relevant study result is the negative correlation between math anxiety and the results on the adapted TIMSS test. Math anxiety is a psychological response characterized by feelings of tension and fear when participating in math-related tasks (Krinzinger, Kaumann, & Willmes, 2009). Various studies have shown that students can exhibit math anxiety even at the beginning of elementary school (Gunderson, Park, Maloney, Beilock, & Levine, 2018). Often, this anxiety increases during schooling (Levine & Pantoja, 2021) and is negatively related to students’ math competence (Ashcraft & Krause, 2007; Suinn, Taylor & Edwards, 1988). The result obtained in our study provides more evidence about the importance of socio-emotional factors, in this case, math anxiety, in the development of students’ math ability.
It is also important to highlight the limitations of the studies presented:
- We do not know the schools’ results before they started using Innovamat, so a direct causal effect between using the curriculum and better student performance on the TIMSS test cannot be attributed. To compensate for this limitation, the study was conducted over different editions and regions, with a total sample of 4,393 students (2,407 with Innovamat and 1,986 without Innovamat). In addition, whenever possible, it was ensured that the socioeconomic characteristics of the schools in the intervention and control groups were similar, using the HDI as an approximation of each school’s socioeconomic level. In Catalonia, demographic data from the schools could not be obtained, so we cannot confirm that the control and intervention groups were sufficiently similar.
- Another aspect to keep in mind is that the intervention was not random. Schools in the intervention group showed interest in using the Innovamat curriculum, while schools in the control group did not want to. Therefore, the differences between schools may not be solely due to the use of different educational materials but also to intrinsic characteristics of the schools, such as the willingness to innovate, the motivation to improve students’ math education, the capacity for action, and access to educational resources etc.
- Finally, another limitation is the existing conflict of interest, because the research was developed by a team of researchers working directly with Innovamat.
In summary, the study shows positive and promising results regarding the use of Innovamat in school to achieve good performance in competency-based math tests, such as the TIMSS test. Over two different academic years and in two different regions, with more than 4,000 students analyzed, we observe better test results for schools that followed the Innovamat curriculum compared to those that used other educational approaches.
However, the study design does not allow for conclusive evidence regarding the positive impact of Innovamat on students’ mathematical development. Therefore, it is important to continue researching in other contexts and with different designs to further our understanding of the impact that an educational curriculum like Innovamat has on students.
Footnotes
1
The Scheirer-Ray-Hare test, like the ANOVA test, is a statistical test used to identify significant differences between two groups in a sample. As a parametric test, ANOVA requires that the data meet certain conditions, including normality in the distribution of residues. Since our data did not meet this condition, we opted for the non-parametric Scheirer-Ray-Hare test, which allows analysis without normality.
2
We consider p-values < .05 as significant, following the standard in the field of social sciences. Additionally, we consider p-values between .05 and .1 as marginally significant. In this latter case, it is not possible to assert that one variable affects another, but it also does not allow us to assert the opposite. The best practice would be to continue studying the effect of the variable in the future.
References
Carey, E., Devine, A., Hill, F., & Szűcs, D. (2017). Differentiating anxiety forms and their role in academic performance from primary to secondary school. PLOS ONE, 12(3), e0174418. https://journals.plos.org/plosone/article?id=10.1371/journal.pone.0174418
Caviola, S., Primi, C., Chiesi, F., & Mammarella, I. C. (2017). Psychometric properties of the Abbreviated Math Anxiety Scale (AMAS) in Italian primary school children. Learning and Individual Differences, 55, 174-182. https://doi.org/10.1016/j.lindif.2017.03.006
Cohen J. (1988). Statistical Power Analysis for the Behavioral Sciences. New York, NY: Routledge Academic. https://doi.org/10.4324/9780203771587
Hopko, D. R., Mahadevan, R., Bare, R. L., & Hunt, M. K. (2003). The Abbreviated Math Anxiety Scale (AMAS): Construction, validity, and reliability. Assessment, 10(2), 178-182. https://doi.org/10.1177/1073191103010002008
Math Anxiety and Math Ability in Early Primary School Years—Helga Krinzinger, Liane Kaufmann, Klaus Willmes, 2009. (s. f.). Recuperado 12 de noviembre de 2024, de https://journals.sagepub.com/doi/abs/10.1177/0734282908330583
Gunderson, E., Park, D., Maloney, E., Beilock, S., & Levine, S. (2017). Reciprocal relations among motivational frameworks, math anxiety, and math achievement in early elementary school. Journal of Cognition and Development, 19. https://doi.org/10.1080/15248372.2017.1421538
Levine, S. C., & Pantoja, N. (2021). Development of children’s math attitudes: Gender differences, key socializers, and intervention approaches. Developmental Review, 62, 100997. https://doi.org/10.1016/j.dr.2021.100997
Ashcraft, M. H., & Krause, J. A. (2007). Working memory, math performance, and math anxiety. Psychonomic Bulletin & Review, 14(2), 243-248. https://doi.org/10.3758/BF03194059
Suinn Mathematics Anxiety Rating Scale for Elementary School Students (MARS-E): Psychometric and Normative Data—Richard M. Suinn, Susan Taylor, Ruth W. Edwards, 1988. (s. f.). Recuperado 12 de noviembre de 2024, de https://journals.sagepub.com/doi/abs/10.1177/0013164488484013