This December has been marked by the publication of the TIMSS Study, a document analyzing mathematics and science performance across various countries worldwide.
But what is TIMSS? What are the tests like? What conclusions can we draw from the results? And, most importantly, what can teachers do to improve mathematics education?
In this article, we will explore all these questions and analyze the tests with our math education glasses, viewing them as learning opportunities.
Understanding the TIMSS 2023 Tests
The TIMSS tests, which stand for Trends in International Mathematics and Science Study, are international standardized exams that evaluate cognitive skills in mathematics and science among 4th and 8th-grade students from approximately 70 countries.
Countries that follow our Core Curriculum and participated in TIMSS include Spain, Chile, Brazil, Italy, and the United States. You can view the complete list of countries and regions that took the TIMSS tests via this link.
From these tests, the organizing entity IEA (International Association for the Evaluation of Educational Achievement), in collaboration with Boston College, publishes a report with various conclusions on performance in mathematics and science, exploring the factors that influence learning. This organization also administers the PIRLS (Progress in International Reading Literacy Study) tests, which evaluate reading comprehension.
The primary goal of these tests is to assess the educational systems of different countries and draw general conclusions about student performance in mathematics and science globally.
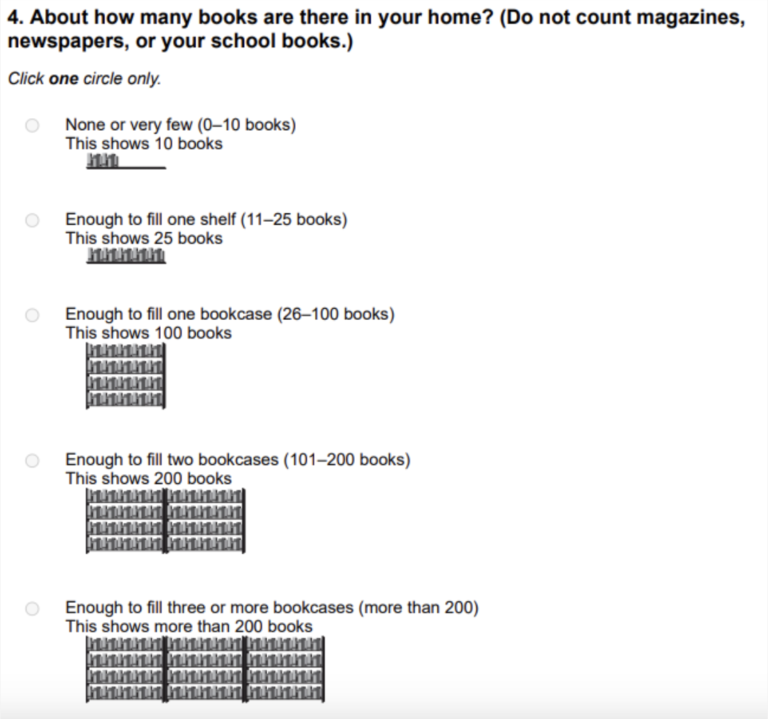
Additionally, the study seeks to understand factors that impact mathematical and scientific abilities. Beyond the tests, questionnaires are administered to students, teachers, and schools to identify socioeconomic conditions, well-being, attitudes, and learning process management.
Here is an excerpt from one of the student questionnaires, where socioeconomic status is determined by the number of books they have at home. You can consult the complete questionnaires at this link.
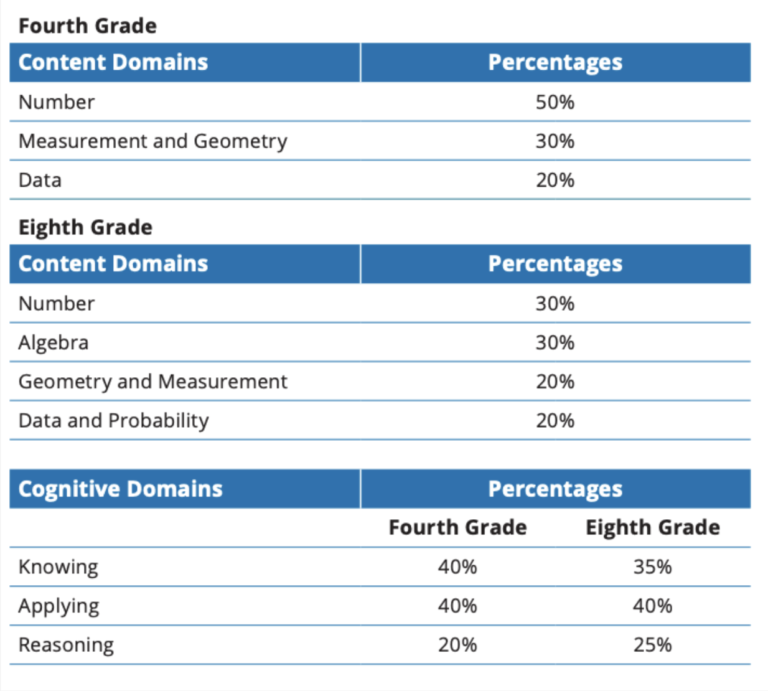
What Do the Tests Assess?
The TIMSS tests evaluate understanding and application of standards content. To achieve this, they focus on three cognitive domains:
- Knowledge: Do students remember and understand mathematical concepts?
- Application: Can they use this knowledge to solve problems?
- Reasoning: Do they apply logical and critical thinking to solve more complex problems?
You can find more information about the assessment criteria here.
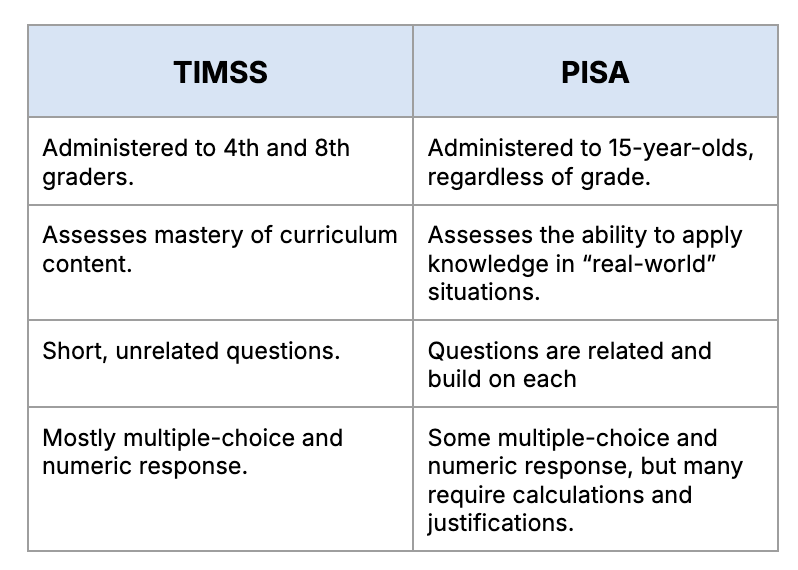
What Is the Test Like? Comparison with PISA
- 55% multiple-choice.
- 41% numeric response.
- 4% open-ended response.
Analyzing the TIMSS 2023 Tests: What Are the Questions Like?
Great! We’ve now seen what the TIMSS tests are like compared to other standardized tests. But what about the problems themselves?
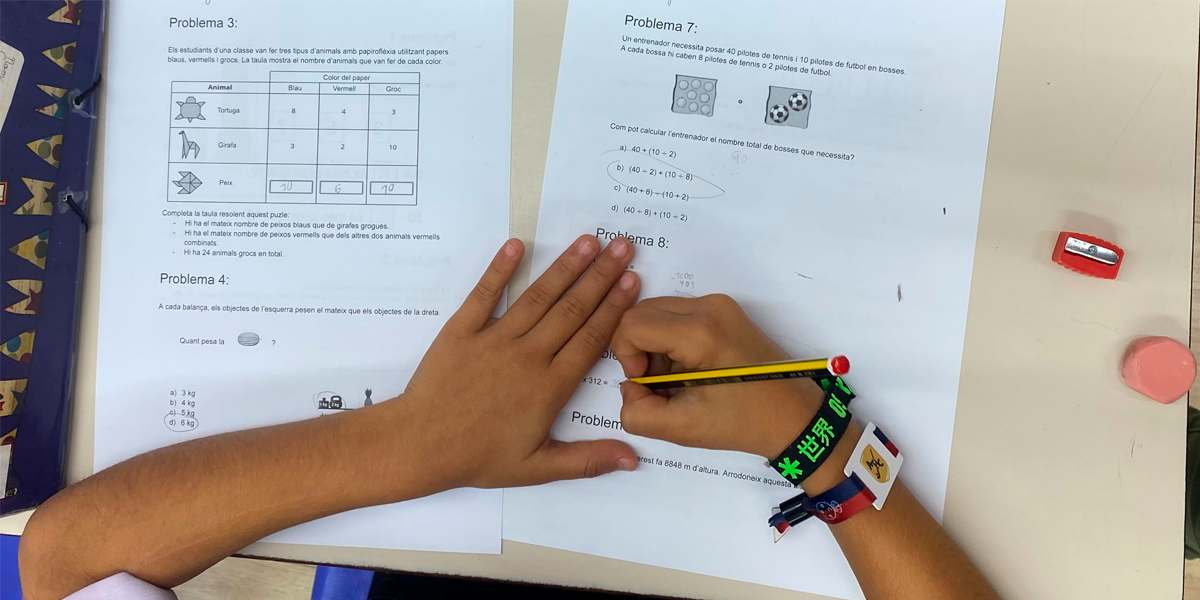
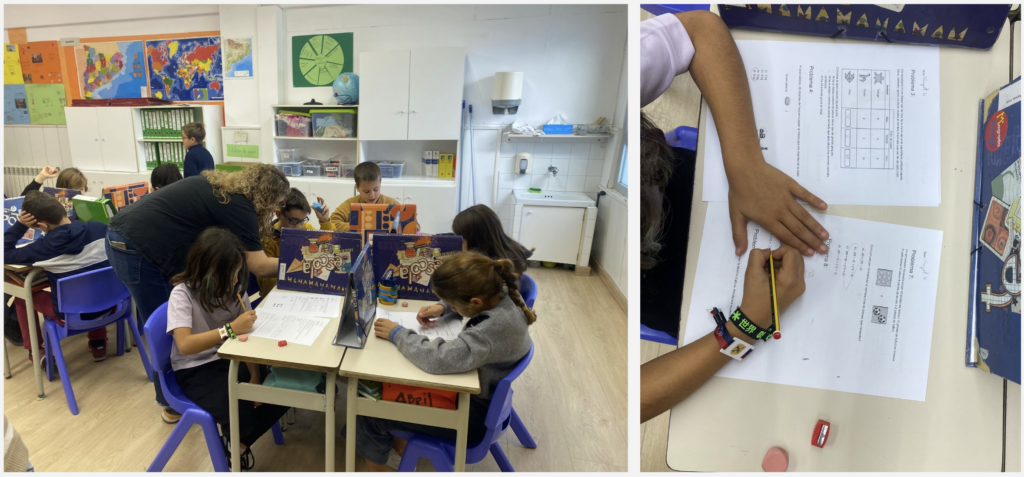
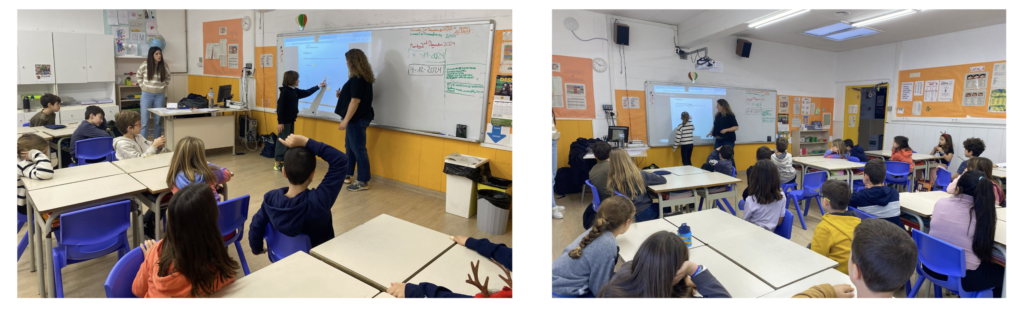
To better understand both the nature of the questions and the test-day conditions, and using the released problems, we decided to conduct a qualitative analysis: we administered the TIMSS test to a 4th-grade class. (A big thanks to Escola Tecnos in Terrassa, Catalonia, for opening their doors to us).
One aspect that caught our attention was the time factor. If students had to answer 50 questions in 60 minutes, that meant they had just about one minute per question.
To contextualize, we gave the same questions to adults, providing them with one minute to answer.
Question 1
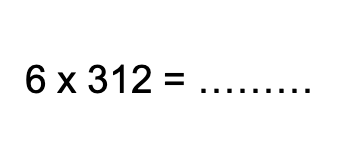
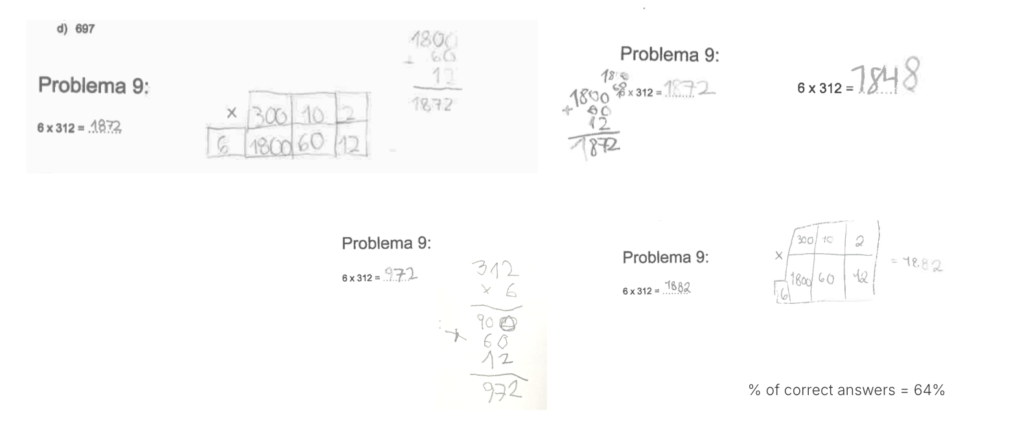
It is interesting to observe the different methods students used: while some solved the operation vertically, others broke it down.
Some students, despite correctly solving the multiplication, made mistakes in the addition. Others, however, got confused in the multiplication but completed the rest of the operation correctly.
Question 2
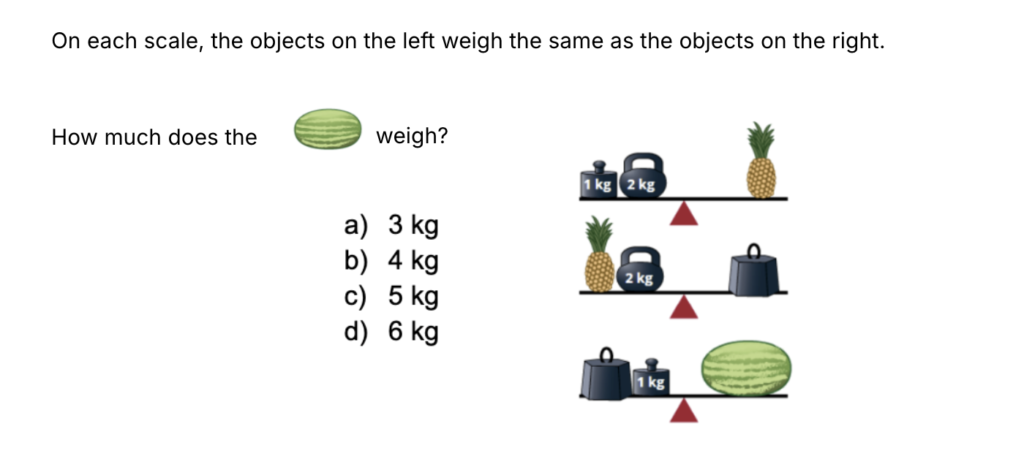
This is a pre-algebra question requiring deduction, and overall, most students reasoned correctly and arrived at the answer.
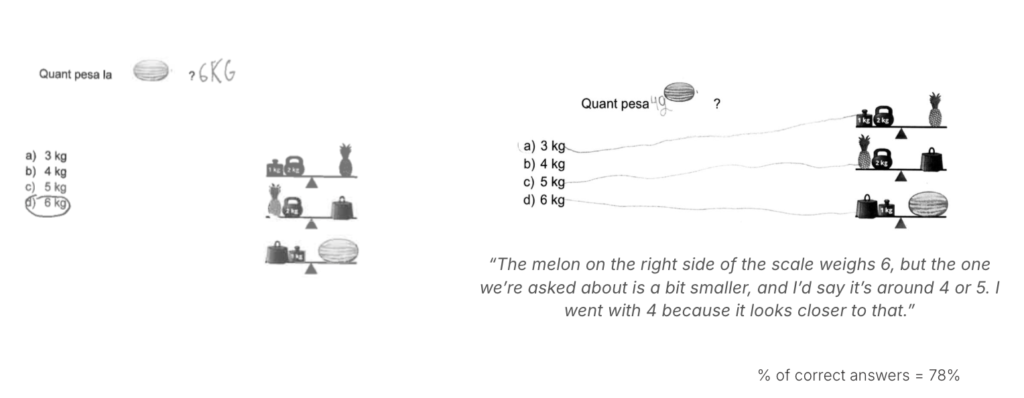
Original reasoning approaches were detected. For example, some students noticed that the watermelon in the question was smaller than the example and assumed it must weigh less, applying proportional reasoning.
Although we can consider some of these thought processes understandable (like the second example shown), the answer does not meet the test’s standards and is therefore considered incorrect.
Question 3
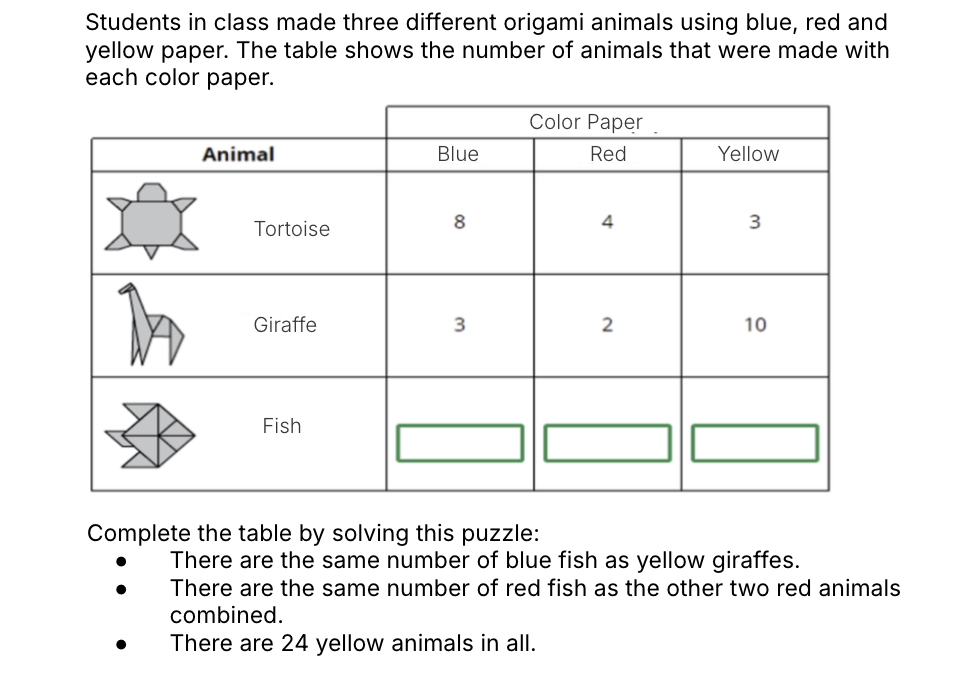
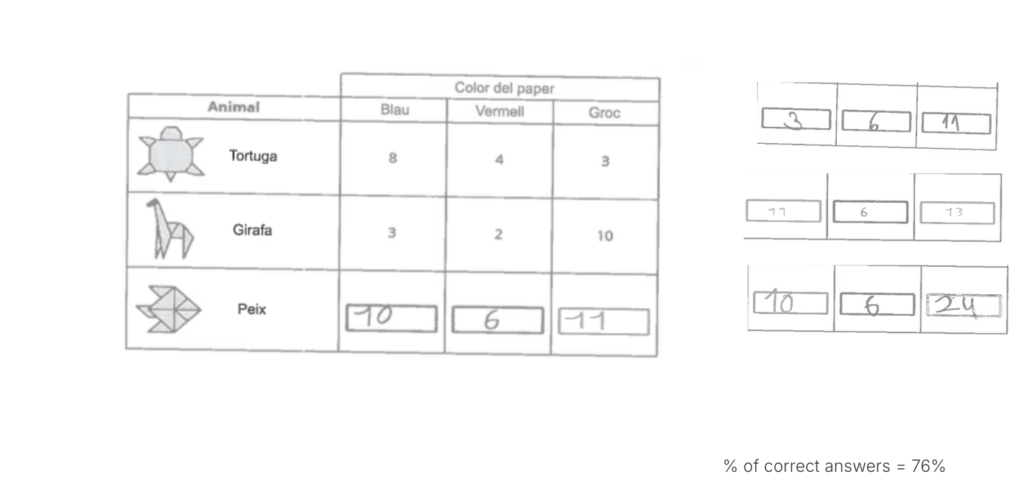
Most students answered correctly. However, errors were detected when counting the blue fish. In this case, some students wrote “3” because, instead of checking the number of yellow giraffes as instructed, they recorded the number of blue giraffes, which appeared just above the field they were supposed to fill in.
A similar error occurred with the calculation of yellow fish. Instead of performing the indicated subtraction — 24 minus 3 yellow turtles and 10 yellow giraffes — the students wrote “24” directly as the total for yellow fish.
We believe that many of these errors were caused by the time constraint, leading to overly hasty reading of the instructions. Qualitatively, we also observed that the long wording and placement of the table in the middle made the comprehension process more difficult.
Question 4
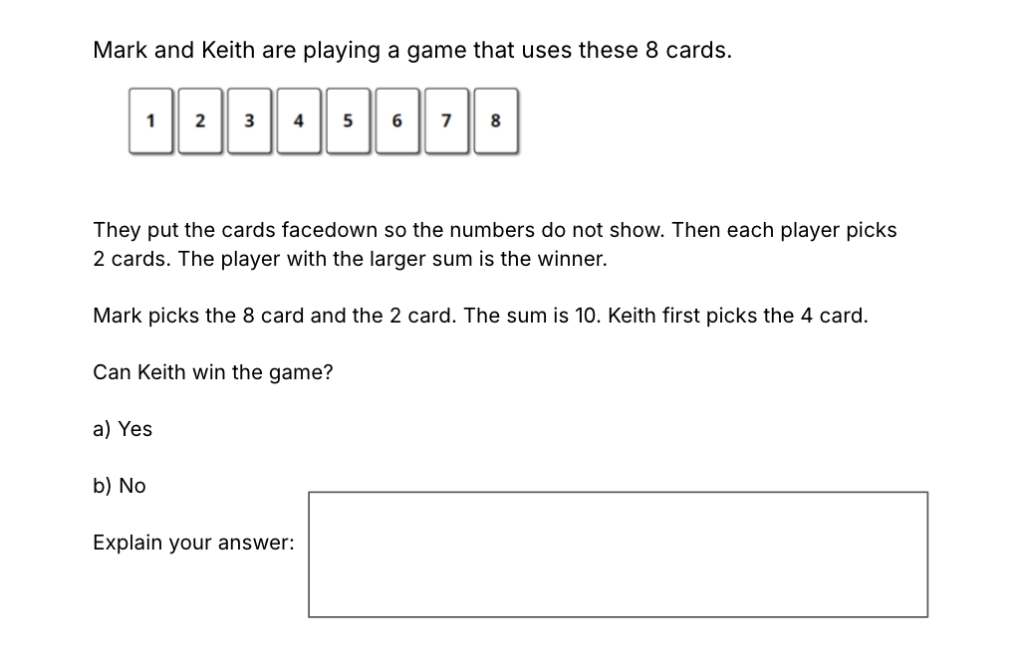
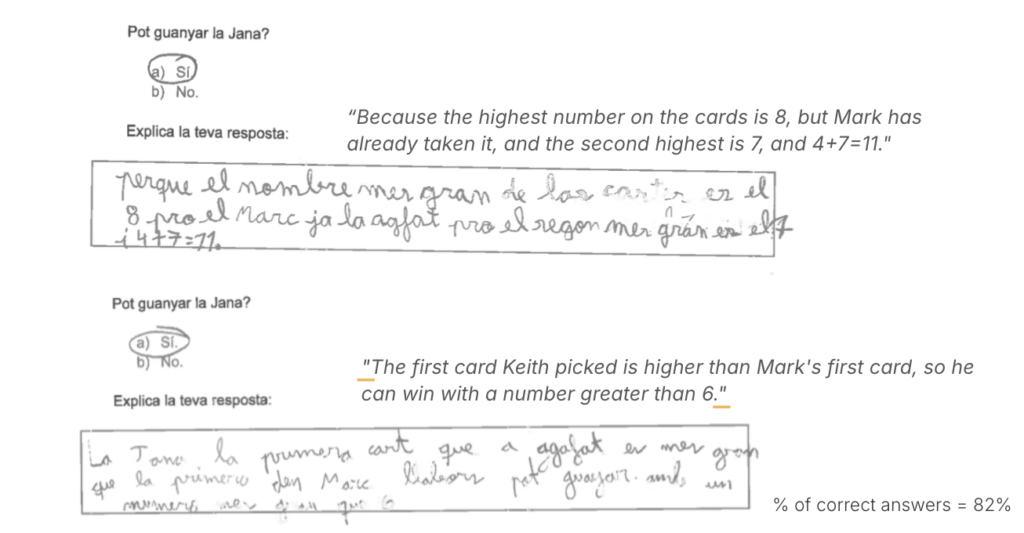
The scoring criteria required justification. For this reason, only responses that clearly explained the process were considered valid, such as: “Yes, they can still pick card 7, and that makes 4+7=11, which is greater than 10.”
If students simply said “yes” because the number 7 could be picked, without providing any further explanation, the answer was not considered correct.
Question 5
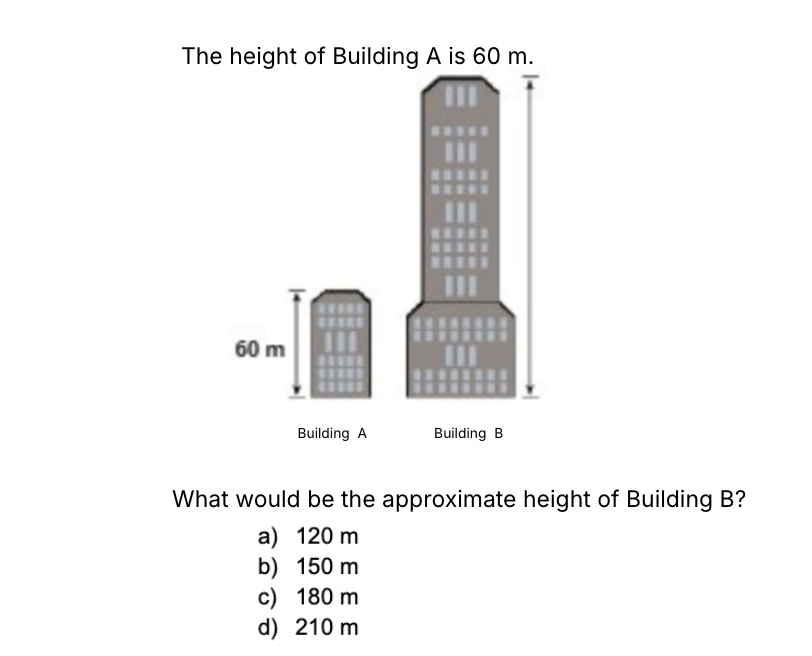
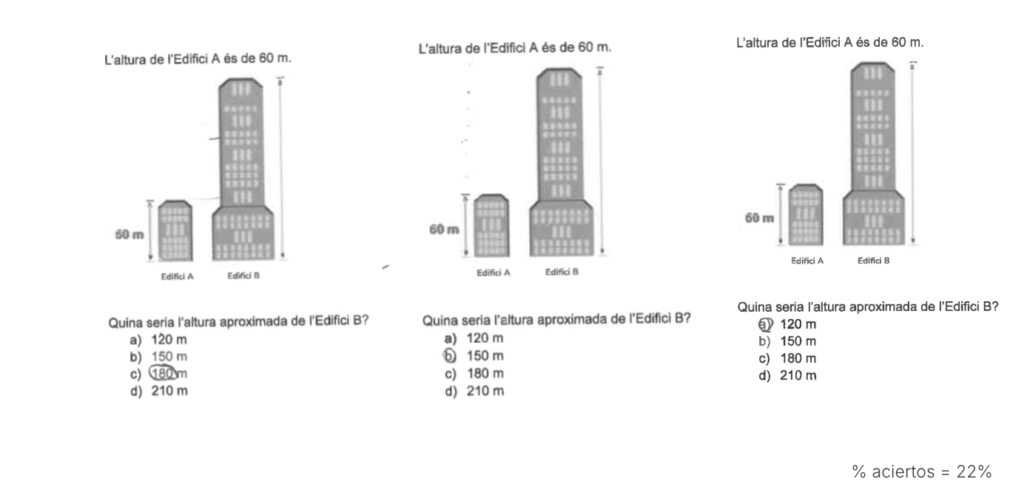
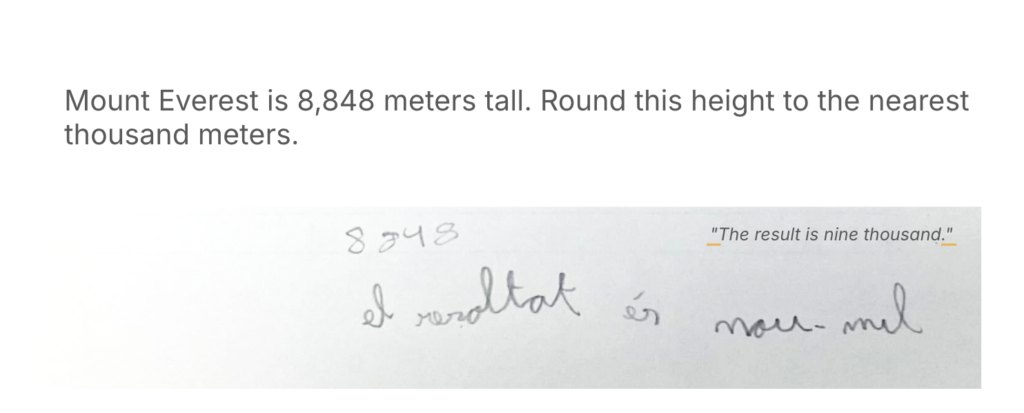
In this case, we observed a lower number of correct answers compared to the previous questions. Many students responded with 150 m or 120 m, while the correct answer was 180 m.
The wording referred to an approximation, which could have been confusing for the students, as the actual result was exactly three times the original, meaning the answer was exactly 180 m. Additionally, there may have been an optical effect that induced error, given that the test was administered digitally and without the use of a ruler.
Question 6

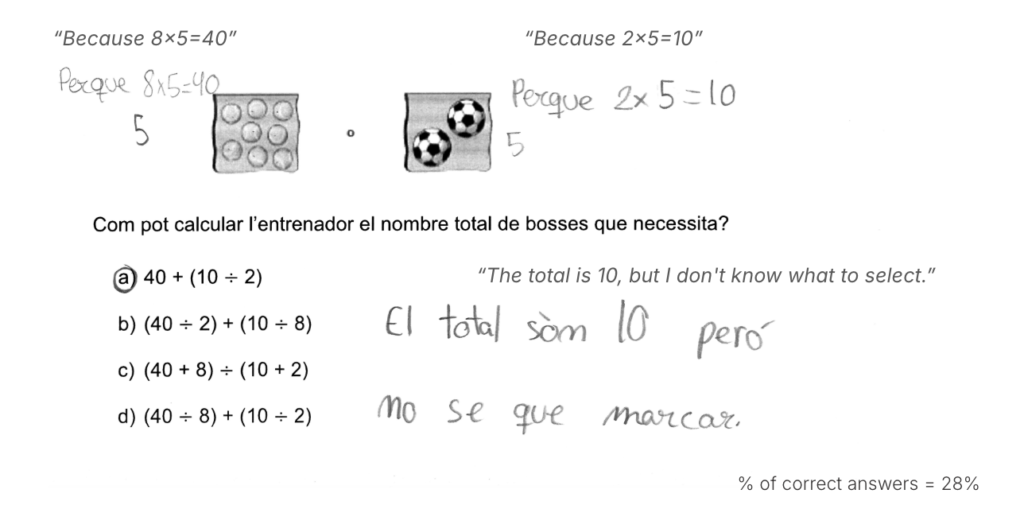
This is a question involving combined operations. Here, the goal was not to test whether students had already been taught to solve these types of operations, but rather to assess whether they could deduce or interpret the symbolic representations to find the correct answer.
A curious observation was that students who approached the problem using multiplication (instead of division) did not correctly identify the steps, even though they reached the correct answer through their reasoning.
Other Interesting Findings
What Did We Observe?
- Direct application of a procedure: For example, the multiplication problem, where students needed to perform a specific operation.
- Competency-rich problems: Like the animal or watermelon questions, which required more complex reasoning.
- Tricky problems: Such as the building problem, where careful interpretation of the instructions was essential to avoid confusion.
- Beyond our curriculum: Like the ball problem, which went beyond learned notions to test the student’s ability to draw conclusions without consolidated knowledge.
How Did the Activity End?
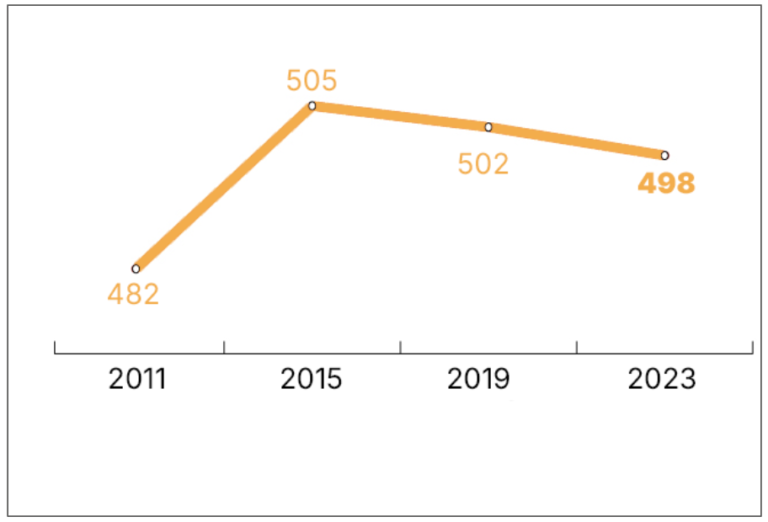
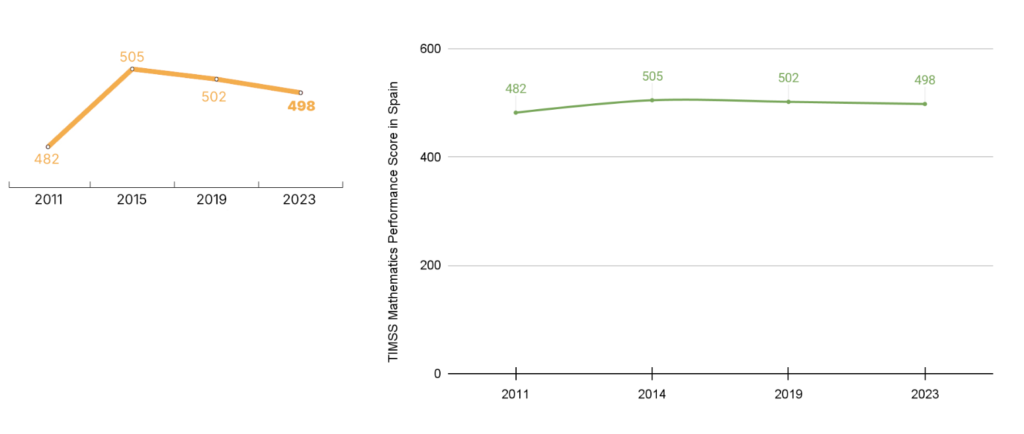
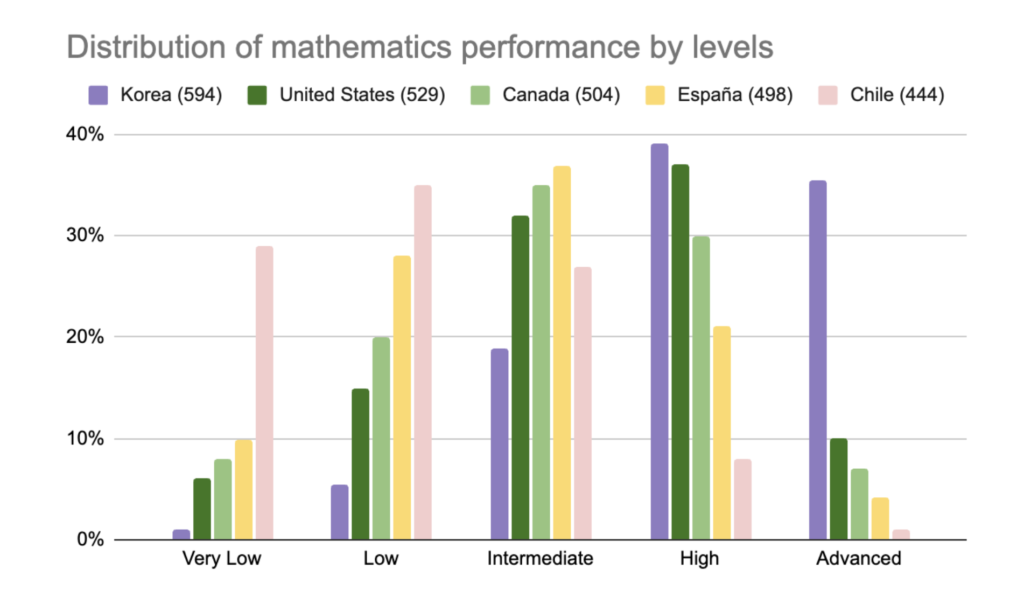
What Do the Results Show Us?
What Can We Do to Improve?
Addressing today’s educational challenges requires going beyond rote learning. It is not just about understanding content but internalizing mathematical processes to overcome low performance levels.
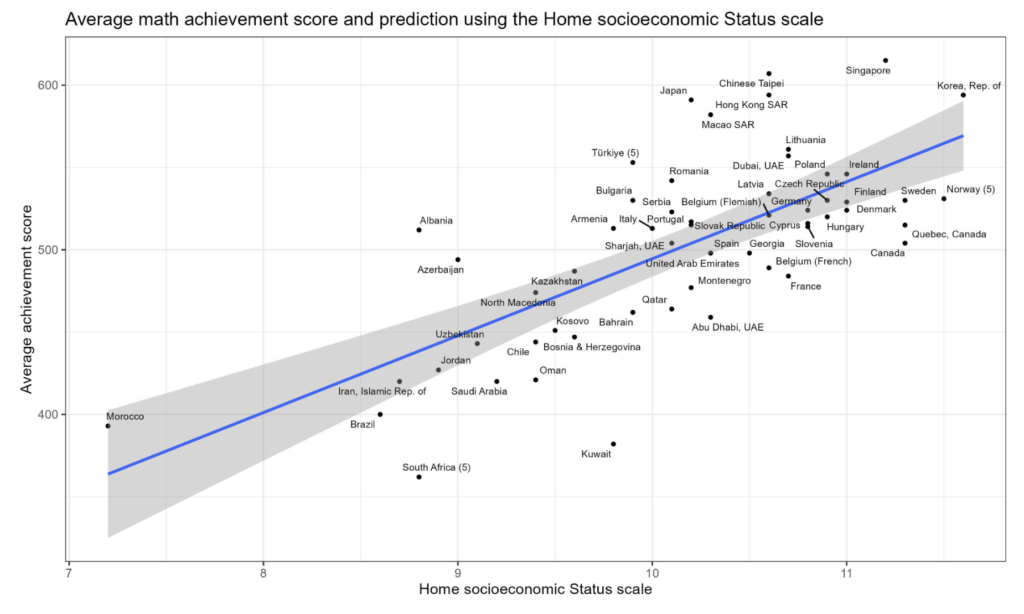
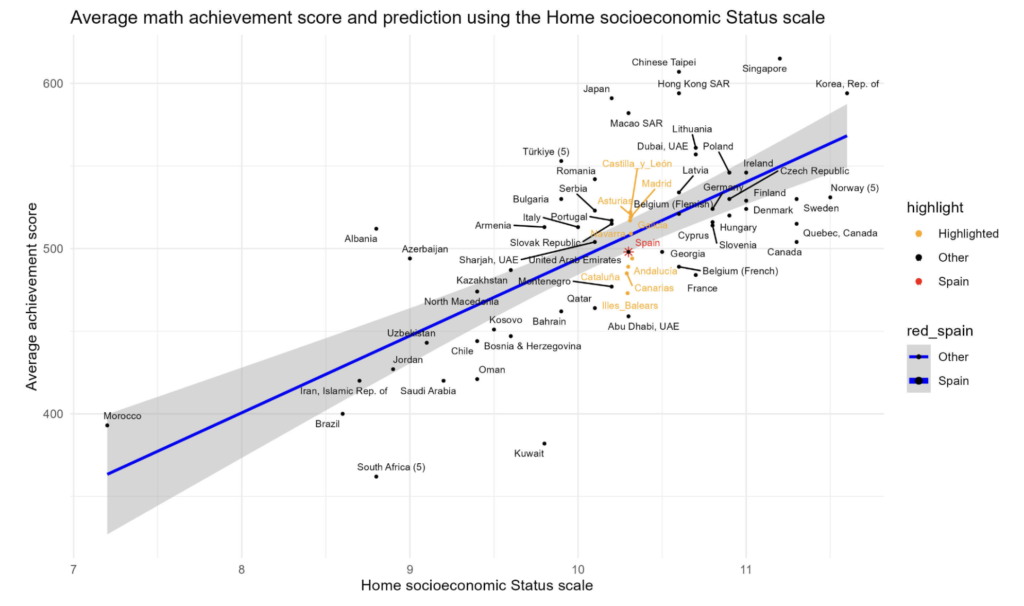
Competency-based learning, which fosters reasoning, argumentation, and critical thinking, is key to tackling more complex questions. However, when interpreting results, we must consider various factors, such as students’ socioeconomic contexts.
Faced with a problem that is so complex and multifactorial, it is essential to combine efforts from all areas to improve education and, consequently, performance.
Let’s continue working together to improve mathematics education!