Being aware of the normal maturation process of children is fundamental in ensuring a proper evolution. For example, we take children to the pediatrician to find out if their height or weight is what is expected for their age. There, the doctor compares the child’s measurements with the normality curves for their region (example in Figure 1) and makes the corresponding medical decisions.
Figure 1. Height and weight curves in males aged 2 to 20.
This analytical process is also crucial in education, since we need objective information on the evolution of students in order to make the appropriate educational decisions in case of mismatches.
Study analysis and results
At the end of last year, Innovamat carried out a study to obtain objective information on the evolution of children in specific mathematical aspects; the study of mathematical performance curves (also called A999). Our study variable, in this case, was additive arithmetic fluency, that is, the amount of addition and subtraction in small ranges that children are able to do in a specific time (2 minutes, in our test).
So, we created a digital activity for the Innovamat App that measures this fluency, and had about 85,000 Innovamat children from Kindergarten to 6th grade do it at the end of the school year (addition in the 0-10 range for children in Kindergarten and 1st grade, and mixed addition and subtraction in the 0-20 range from 2nd grade onwards).
In Figure 2 you can see the resulting curves, which give us a lot of information.
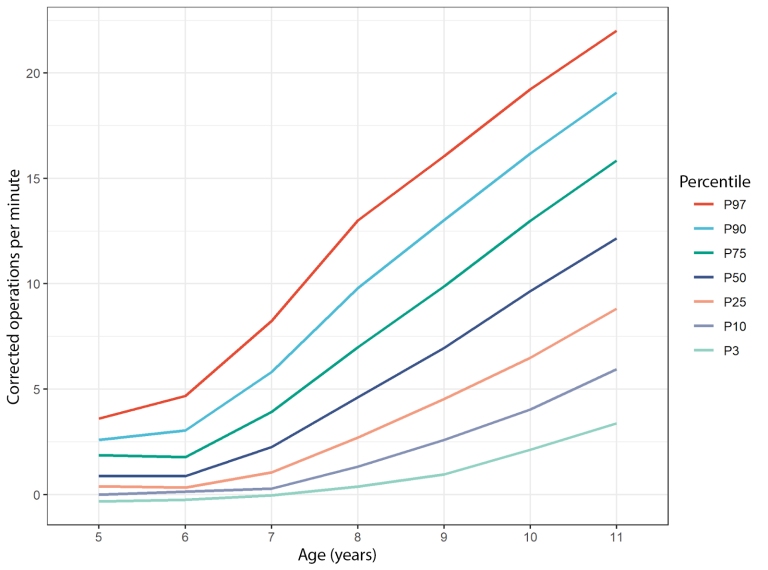
On the one hand, internally at Innovamat, we are now able to monitor the evolution of students in this aspect and better help teachers to make the relevant educational decisions, if necessary.
On the other hand, we also see other interesting effects. For example, the width of the distributions (i.e., the distance between the lowest and highest percentiles) is much smaller in early grades than in later grades. This shows us that low-achieving children not only have a lower level, but also tend to learn more slowly, so that relatively small differences at the beginning widen to differences that risk being unbridgeable by the end of elementary school.
In Figure 3 we can see another relevant fact, already known theoretically, but which is difficult to perceive empirically because it requires a very high number of observations. As indicated in the Figure, there are some ‘bumps’ in the early grade distributions that tend to disappear as children get older and have been in school longer, even resulting in a statistically normal distribution at older ages
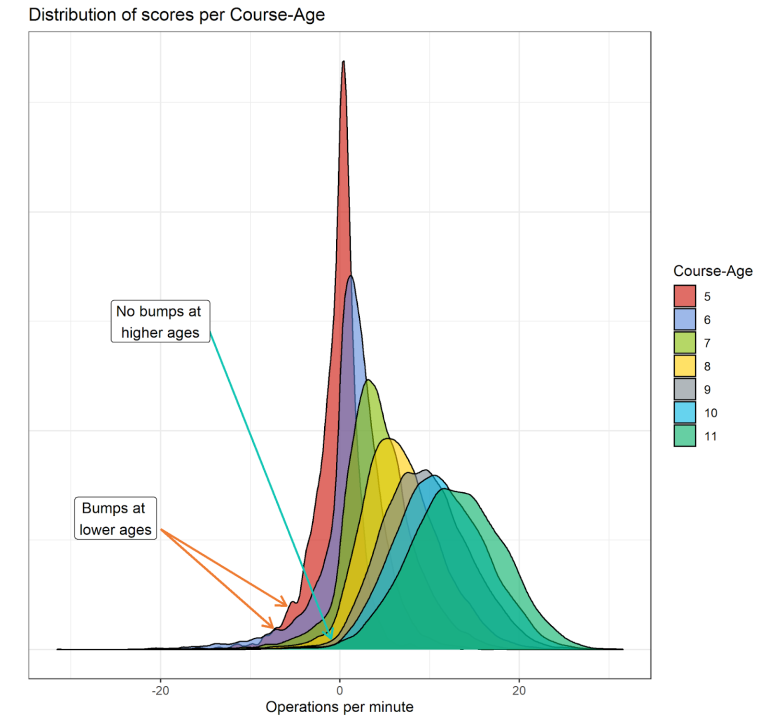
From this we can infer two things: the first is that there are students who arrive at kindergarten or 1st grade with very poor non-formal understanding of mathematics (usually provided by the family, if they have not been schooled) and, therefore, we see a higher number than would be expected at a very low percentile.
As this effect is corrected by formal education, what we see is that the distribution becomes increasingly normal (i.e., it forms a Gaussian Distribution). From this we can infer a very relevant conclusion: dyscalculia (which we discussed in this other article) is not an’all or nothing’ phenomenon (like having the flu or being pregnant), but is the tail of a normal distribution (like hypertension or hypercholesterolemia). This is a fact that was discovered 30 years ago for dyslexia (Shaywitz, S. E. et al., 1992), but, to our knowledge, it has not yet been demonstrated for dyscalculia. Thanks to this study and those that will follow, we hope to be able to contribute.
Shaywitz, S. E., Escobar, M. D., Shaywitz, B. A., Fletcher, J. M., & Makuch, R. (1992). Evidence that dyslexia may represent the lower tail of a normal distribution of reading ability New England Journal of Medicine, 326(3), 145-150.